03.3: Traffic Analysis Zones
This post is part of the Case Study: Simulating Durham Region. In this case study, we get the relevant data and road network, create Traffic Analysis Zones (TAZs), generate trips based on origin-desitination data, create routes, and run simulation.
This post generates Traffic Analysis Zones (TAZs) based on the Durham region shapefile (polygons of planning districts) and the map.net.xml generated in the previous post.
TAZs are defined in this tutorial as:
Traffic Analysis Zones (TAZs) are spatial units used in transportation modeling and traffic studies to represent areas with similar travel behavior. A TAZ typically models a neighborhood or district, and serves as a fundamental unit for estimating travel demand. Each zone can be associated with socio-economic and demographic data, such as population, employment, and land use. This information influences the number and type of trips generated within the area. TAZs are commonly used in trip-based models, such as the traditional four-step travel demand model (trip generation, trip distribution, mode choice, and route assignment).
Generate TAZ polygons
Make sure your current working directory is sumo_workshop.
PROJ_LIB
The polyconvert tool below utilizes the Durham shapefile which contains the projection information about the region. That is possible since we downloaded SUMO with extras. One of those extras is the proj tool. We set the path to proj as an environment variable in powershell:
$env:PROJ_LIB="C:\Program Files (x86)\Eclipse\Sumo\data\proj\"Now we use polyconvert to convert the shapefile to SUMO compatible shapes that can be visualized in SUMO or netedit:
polyconvert --shapefile-prefix "data/durham_taz/durham_taz" `
     --shapefile.guess-projection true `
     --shapefile.traditional-axis-mapping true `
     --shapefile.id-column pd `
     -n "module1/03-osm/map.net.xml" -o "module1/04-taz/taz_polygons.poly.xml"
Then view the taz_polygons.poly.xml.
Now you may visualize the polygons in netedit:
netedit --sumo-net-file "module1/03-osm/map.net.xml" `
    --additional-files "module1/04-taz/taz_polygons.poly.xml"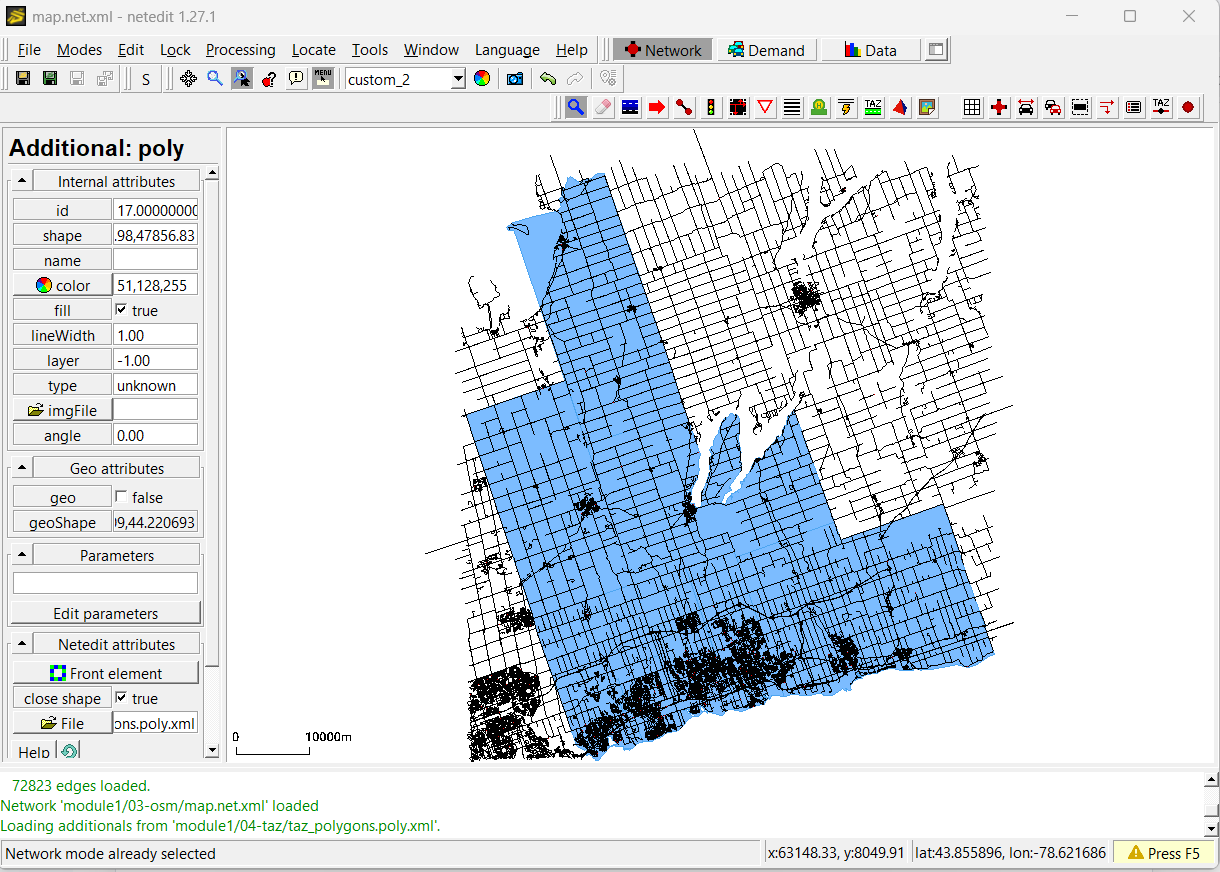
Generate TAZs
Create the TAZs by providing the polygons and network file to the edgesInDistricts.py script. This generates a TAZ file that specifies what edges belong to which TAZ.
uv run "$env:SUMO_HOME/tools/edgesInDistricts.py" `
    -n "module1/03-osm/map.net.xml" `
    -t "module1/04-taz/taz_polygons.poly.xml" `
    -o "module1/04-taz/TAZ.xml"
Open the TAZ.xml file to see the edges in each TAZ.
You may also see just the estimated TAZs:
netedit --sumo-net-file "module1/03-osm/map.net.xml" `
    --additional-files "module1/04-taz/TAZ.xml"
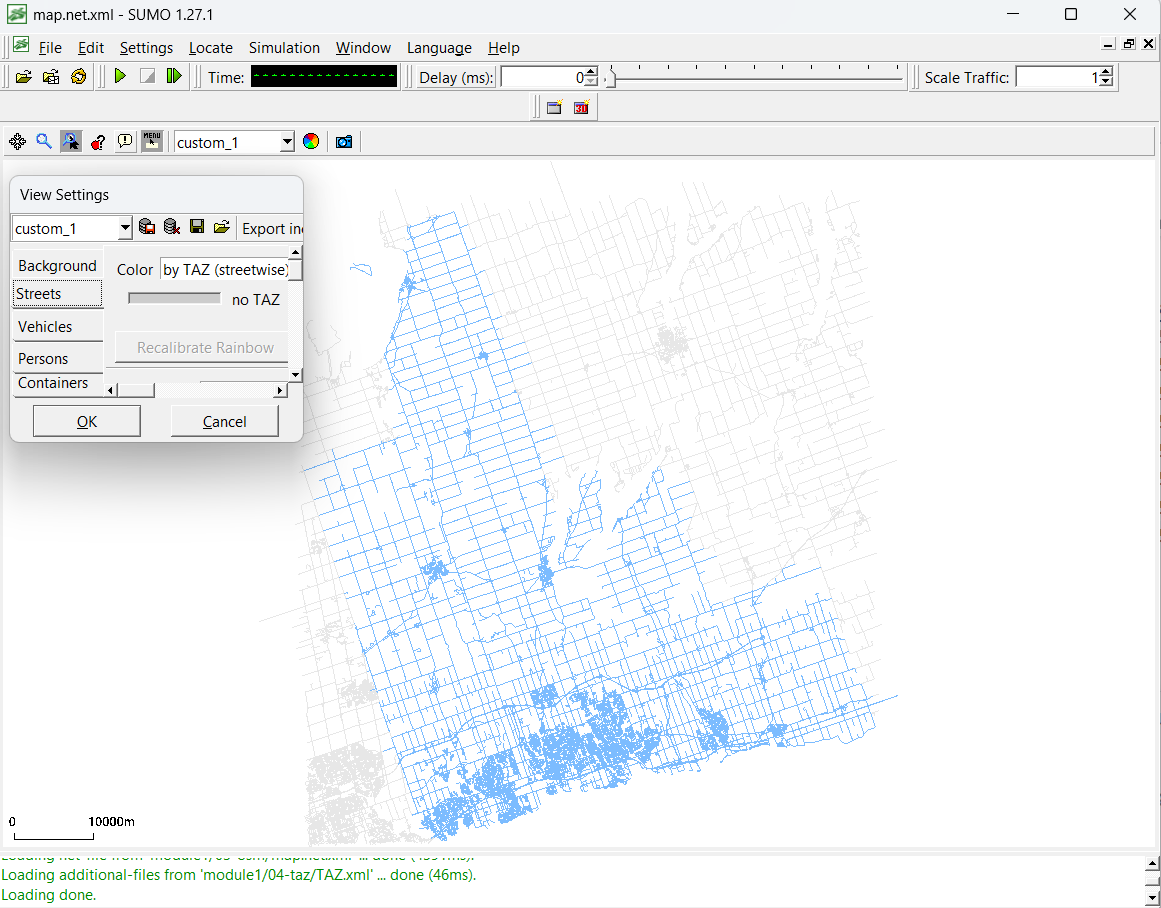
Moreover, you may color the edges by TAZs in SUMO:
sumo-gui -n "module1/03-osm/map.net.xml" -a "module1/04-taz/TAZ.xml"